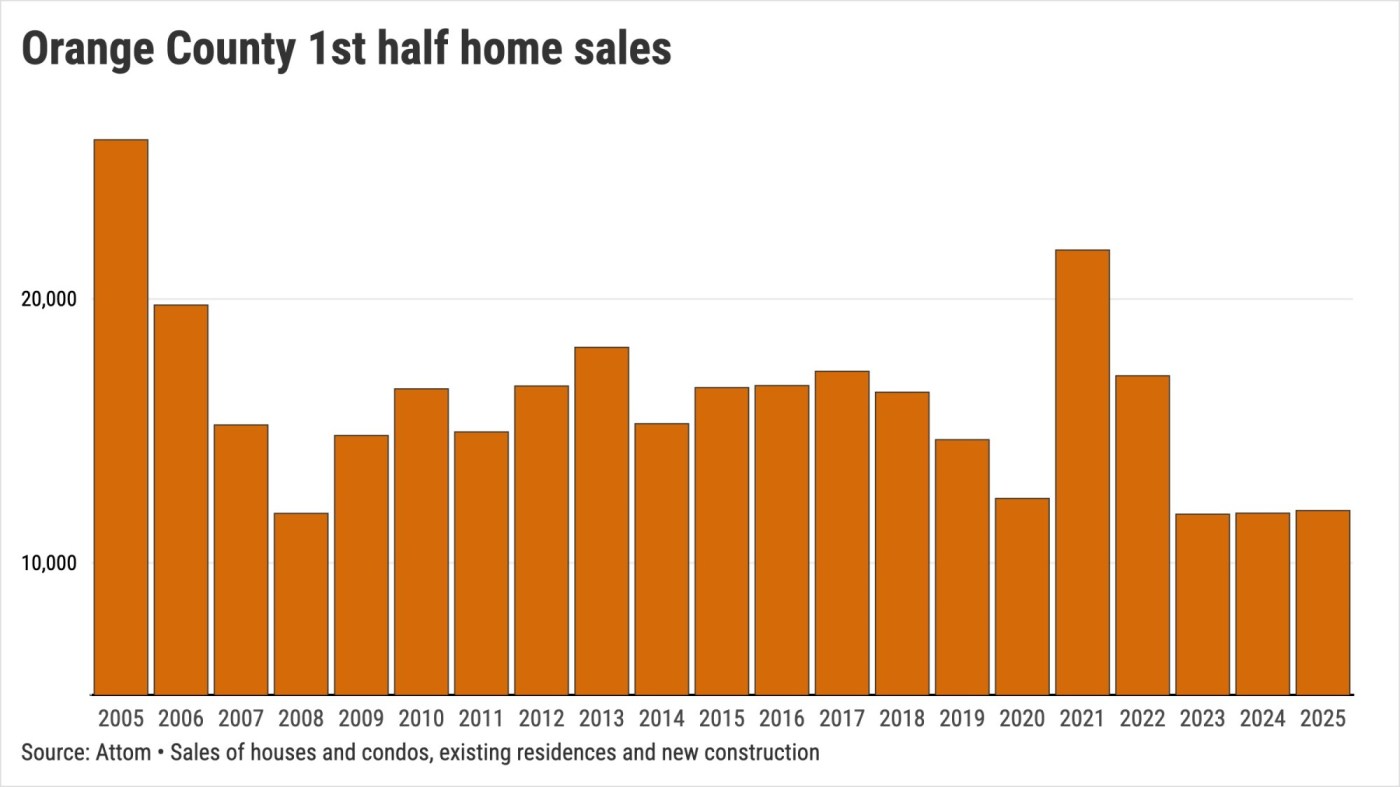
In the first half of 2008, as the global financial system was crashing, 11,878 Orange County homes were sold across
In the first six months of 2025, 11,986 Orange County residences were bought, a mere 1% above the real estate market’s lowest point.
This is a stark reminder, courtesy of my trusty spreadsheet, of the depths of the recent homebuying collapse. Using sales data from Attom, it studied a broad swath of Orange County’s transactions – including houses and condos, both existing residences and newly constructed.
Think about how the pandemic era altered Orange County’s homebuying by examining some simple math: ranking first-half sales going back to 2005 .
The lowest sales count was found in the first six months of 2023. Third-slowest was last year, with 2025 at No. 4. The pandemic-lockdown-slammed 2020 was No. 5.
Oh, and bubble-squashed 2008? No. 2.
The price is wrong
June’s $1.21 million median selling price was Orange County’s all-time high after gaining 19% the past three turbulent years. And that’s a cooling from the 40% price surge between 2019 and 2022.
But it’s worth noting that prices slipped 23% in the three years before 2008’s debacle. Don’t overlook the role of those mid-crash discounts cuts in spurring that era’s homebuying rebound.
Orange County’s sales jumped 25% in the 12 months ended June 2009.
Who can afford it?
What’s up with this slump? Well, it’s what’s down: The number of people who can pay up for a home.
Orange County’s homebuying affordability index from the California Association of Realtors tells us that only 12% of households can theoretically qualify to buy. That’s the same as three years ago, when home loans were below 4% compared to 2025’s near 7% financing costs.
But the latest reading is less than mid-year 2008, when 17% of Orange County folks could theoretically purchase a home.
Jonathan Lansner is the business columnist for the Southern California News Group. He can be reached at jlansner@scng.com