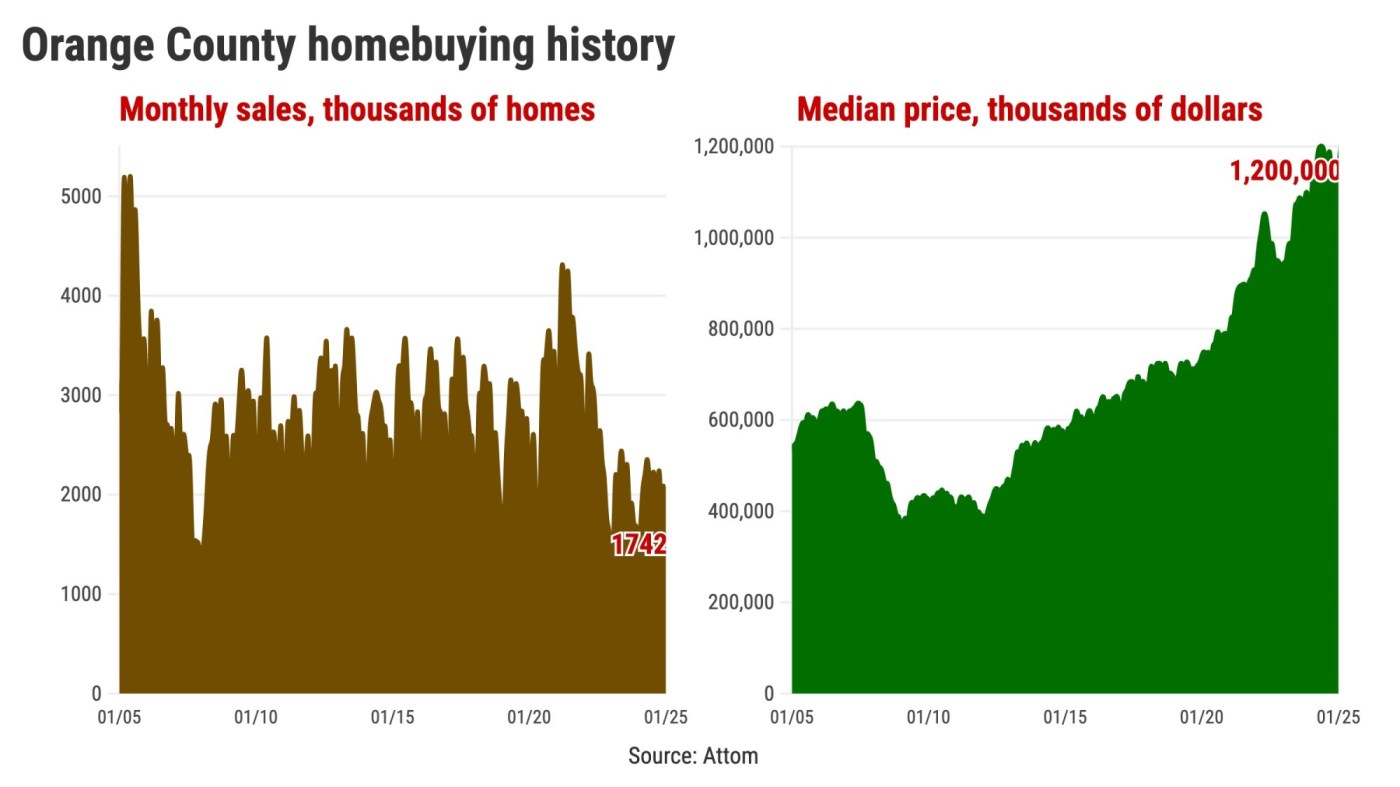
There have been innumerable ups and downs in the history of Orange County homebuying.
The Southern California News Group will now be chronicling home sales and pricing swings using data from a new provider, Irvine-based Attom. The company tracks closed transactions for existing and new housing – single-family homes, condos and their combined totals – going back to 2005.
Please note that tallying home sales contains a lot of science and a little bit of art. Not every transaction has a simple buyer and seller with traditional financing – mortgage or cash. Deciphering the arms-length nature of each sale – and the value changing hands – is not always simple. That means Attom’s stats will slightly differ from our previous data providers: DataQuick, DQNews and CoreLogic, which recently renamed itself Cotality. Those reports are no longer produced.
Let’s glimpse into local homebuying patterns and extremes through our new statistics from Attom. My trusty spreadsheet found 21 peaks and valleys within the Orange County housing market’s gyrations since 2005 through February 2025.
First, consider the price swings for all home sales …
1. Record high: $1.2 million median sales price last reached in February 2025.
2. Great Recession bottom: $365,000 in January 2009, so we’re 229% above that low.
3. 20-year gain: Homes appreciated 127% since 2005.
4. Gains vs. losses: 75% of months had yearly price increases.
5. Biggest 12-month gain: 27% in year ended April 2013.
6. Biggest 12-month loss: 31% in year ended November 2008.
Next, ponder how total sales activity has gyrated over 20 years for existing and newly built properties …
7. Average sales pace: 2,724 closed transactions a month over 20 years. So February 2025’s 1,742 total was 36% below the norm.
8. Busiest month of a typical year: It’s June. Since 2005, the 3,172 average sales are 16% above the norm.
9. Slowest month in a typical year: It’s January. Since 2005, the 2,054 average sales are 35% below par.
10. Fastest-selling single month: 5,178 sales in June 2005.
11. Slowest-selling single month: 1,276 sales in January 2008.
Consider the big slice of the market, single-family houses – existing and newly built …
12. Record high median price: $1.38 million in February 2025.
13. 20-year gain: Single-family homes have appreciated 137% since 2005.
14. Average sales pace: 1,882 a month over 20 years. So February 2025’s 1,164 total was 38% below the norm.
15. Sales extremes of a typical year: Busiest month is June with 2,214 average sales vs. January, the slowest, at 1,407.
Think about the market’s usual bargain, the condo – existing and newly built …
16. Record high median price: $840,500 in November 2024. Compared to February 2025’s $ 812,500, we’re $28,000 off the peak.
17. 20-year gain: Condos appreciated 106% since 2005.
18. Average sales pace: 842 a month over 20 years. So February 2025’s 578 total was 31% below the norm.
19. Sales extremes of a typical year: Busiest month is June with 957 and slowest is January with 647 average sales.
Finally, let’s contrast condos to single-family homes …
20. Condo share of all sales: 31% average over 20 years vs. 32% in February 2025.
21. Condo vs. single-family pricing: Median is 37% cheaper on average since 2005 vs. 33% less expensive in February 2025.
Jonathan Lansner is the business columnist for the Southern California News Group. He can be reached at jlansner@scng.com
