New jobs stats suggest Southern California bosses were cautious about expanding staff as 2025 wound down.
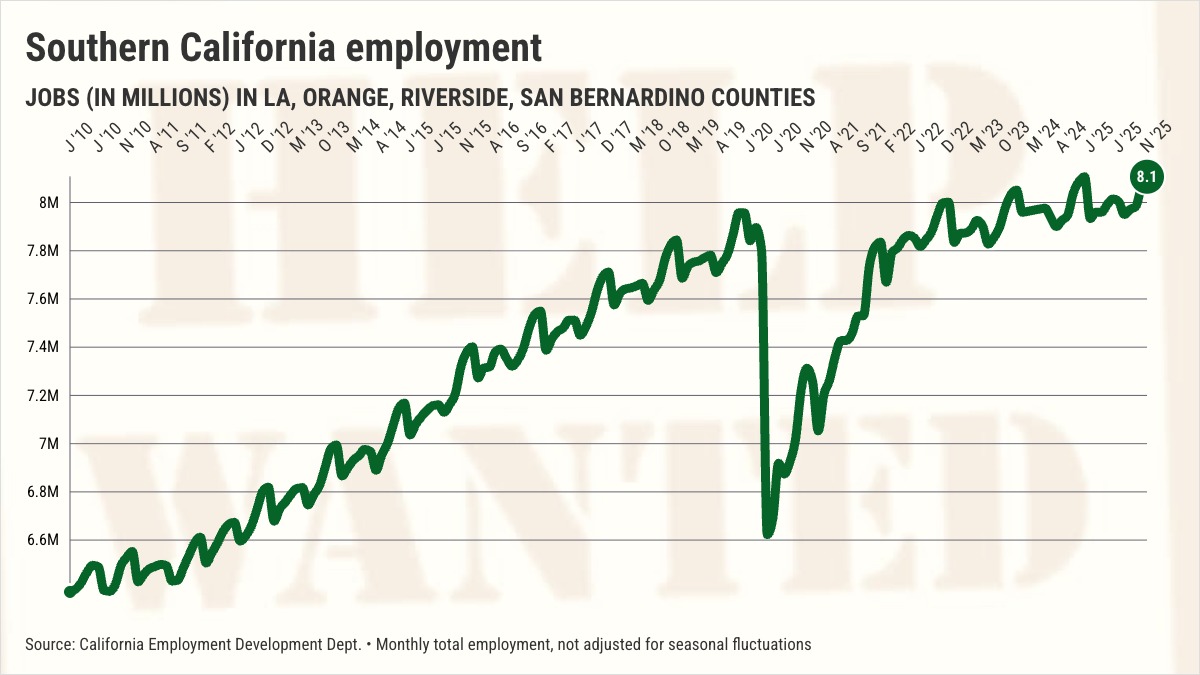
My trusty spreadsheet, filled with recently released employment figures from the Employment Development Dept., found 8.1 million at work in Los Angeles, Orange, Riverside and San Bernardino counties in November. That employment level, which is not adjusted for seasonal swings, was 100 jobs below December 2024’s record high.
Southern California’s bosses added only 20,600 workers in the year ended in November. Now, it’s hard to complain about any additional jobs, but that pace of expansion was modest.
November’s local job growth was far below the 53,300 positions added in the previous year and Southern California’s average annual pace of 105,200 since 2010.
So, hiring was 80% slower than what’s been normal growth in the post-Great Recession era.
Look, it was a challenging year for businesses. Unorthodox economic policies from the Trump administration led to economic uncertainty, at a minimum. And a federal immigration crackdown complicated a local worker shortage, perhaps throttling employment growth.
Like many government economic statistics, the state’s job counts have been delayed due to last year’s federal government shutdown.
As these numbers are reported once again, some economists question the accuracy of the new counts. The U.S. Bureau of Labor Statistics, which does the surveys that help create California’s data, has been rushed to catch up with work skipped during the shutdown.
Joblessness slips
The combined unemployment rate for the regions was 5.3% in November, down from 5.5% a year earlier. By the way, the median monthly local jobless rate is 5.8% since 2010.
There were 488,000 counted as officially out of work, down 2,200 from a year earlier. The jobless count is 4% below the 507,000 median since 2010.
Industry extremes
Over the past year, the local private sector added 11,800 jobs, bringing total employment to 7.2 million. Meanwhile, the region’s government employers, which had 915,000 workers, up 8,800 in 12 months.
That means that private businesses, 88% of Southern Californian employment, were just 57% of job creation.
Next, contemplate the past year’s biggest job swings in major local business sectors.
The region’s healthcare employers had 1.02 million workers, up 48,700 since November 2024. And social assistance firms employed 226,300 workers – up 10,900 from the previous year. These two niches have been big job creators for many years.
Conversely, construction’s 349,700 workers were down 19,400 in the past year. High mortgage rates have cooled development.
And 848,000 workers in professional services were down 18,700 over 12 months. This dip comes with additional pain, as many of these white-collar positions offer good salaries.
Regional differences
Here’s how the job market performed in the region’s key metropolitan areas in November …
Los Angeles County: 4.65 million workers after adding 11,300 in 12 months vs. 45,900 annual pace since 2010. Unemployment ran 5.7%, the same as a year ago and below the 6.1% median since 2010.
Orange County: Record-high 1.71 million workers after adding 5,300 in 12 months vs. 21,000 annual pace since 2010. Unemployment was 4.1% vs. 3.7% a year ago and 4.3% at the median since 2010.
Inland Empire: Record-high 1.74 million workers after adding 4,000 in 12 months vs. 38,300 annual pace since 2010. Unemployment was 5.4% vs. 4.9% a year ago and 6.1% at the median since 2010.
Jonathan Lansner is the business columnist for the Southern California News Group. He can be reached at jlansner@scng.com