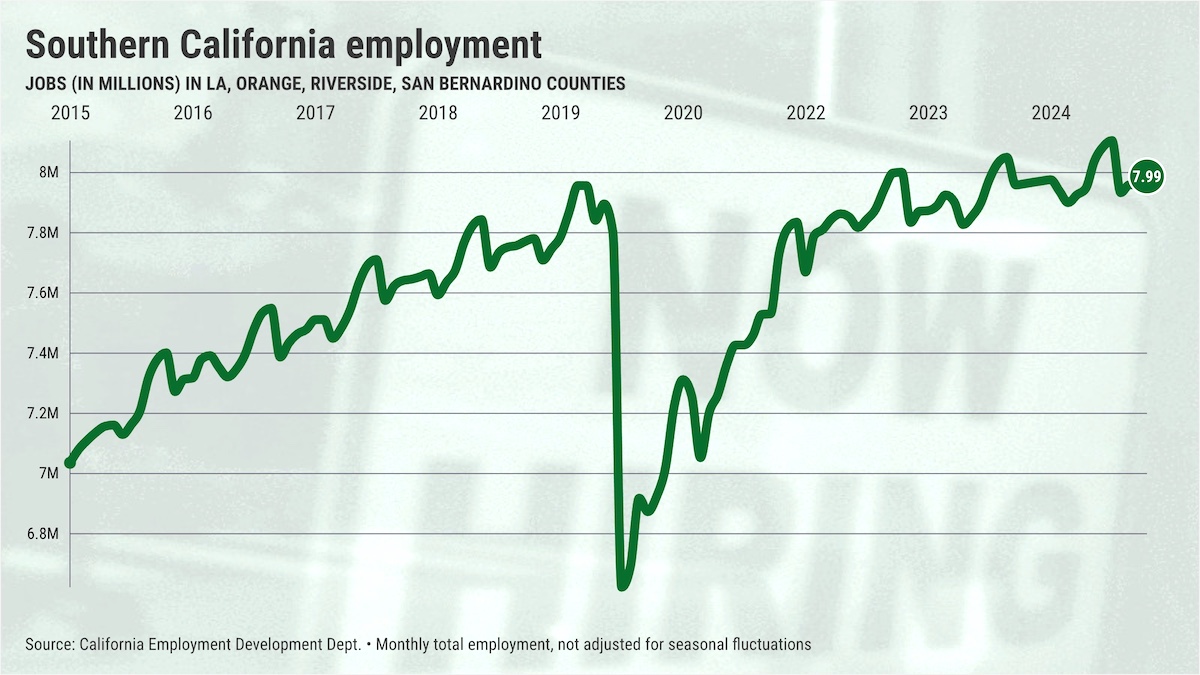
Southern California’s job market showed robust growth in April with hiring that defied other economic dark clouds.
My trusty spreadsheet, filled with state job figures that have not been adjusted for seasonal fluctuations, revealed 7.99 million people at work in April — up 27,500 in a month — across Los Angeles, Orange, Riverside and San Bernardino counties. Since 2010, April has had a median 19,100 local jobs added.
But it’s still a wobbly economy. For example, local bosses have added 15,000 workers since April 2024. That’s far below the 83,400 new positions in the previous 12 months and the 101,400 positions typically added annually since 2010.
Or look at it this way: The past year’s growth rate of 0.2% is far below the 1.1% rate during the previous 12 months and 1.4% over the last 15 years.
By industry, April’s hiring sprees were found in construction – 357,800 workers, up 6,300 in April – and healthcare, with a record 860,700 workers, up 4,100 for the month. Also at a peak: government at 1.06 million, social assistance at 536,100, and private education at 225,100.
Ponder the businesses making April’s largest cuts. The’re tied to shopping, a possible sign of consumer skittishness. Retail’s 715,200 workers were down 2,500. Logistics and utilities’ 789,800 jobs fell by 1,500.
April’s employment increase helped lower regional joblessness. The four-county unemployment rate dipped to 4.8% from 5.1% in March. However, the latest rate tops the 4.6% unemployment of April 2024. By the way, the region’s median monthly jobless rate has been 5.8% since 2010.
There were 430,400 people officially counted as out of work. That was down 25,000 in a month, but it’s up 21,400 in a year. April’s jobless count was 14% below the 501,900 median since 2010.
Regional differences
Here’s how the job market performed in the region’s key metropolitan areas in April …
Los Angeles County: 4.59 million workers, after adding 16,100 in a month and growing by 8,300 in a year. Historically, 6,500 additions in the month. Unemployment? 5.1% vs. 5.5% a month earlier, 5.4% a year ago and 6.3% median since 2010.
Orange County: 1.69 million workers, up 5,000 in a month and growing by 3,500 in a year. Historically, 8,000 additions in the month. Unemployment? 3.7% vs. 3.8% a month earlier, 3.3% a year ago and 4.3% median since 2010.
Inland Empire: 1.7 million workers, up 6,400 in a month and growing by 3,200 in a year. Historically, 7,200 additions in the month. Unemployment? 4.9% vs. 5% a month earlier, 4.5% a year ago and 6.3% median since 2010.
Jonathan Lansner is the business columnist for the Southern California News Group. He can be reached at jlansner@scng.com