While Southern California employers collectively added jobs in the past year, nine of 15 major industries were trimming staff.
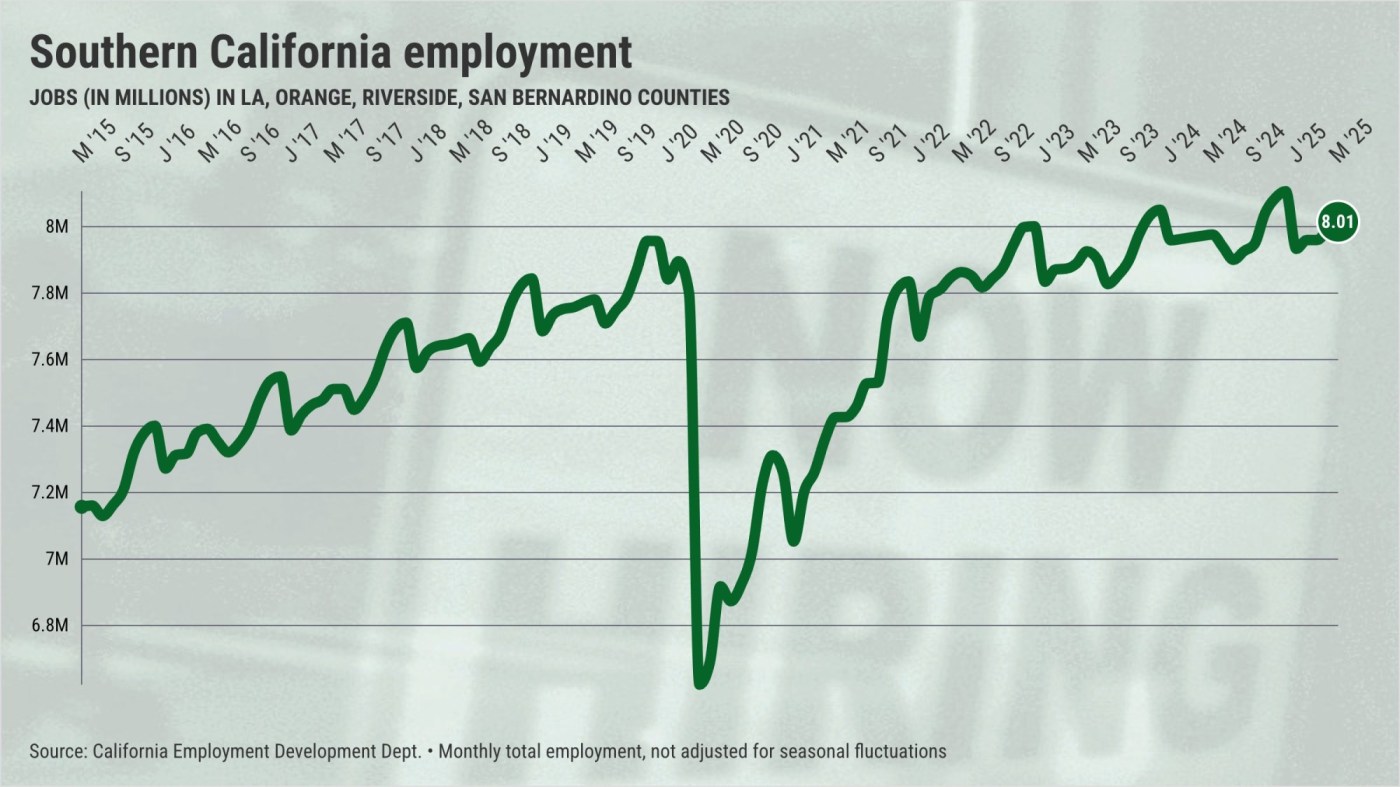
My trusty spreadsheet, filled with state job figures, found 8 million people at work in Los Angeles, Orange, Riverside and San Bernardino counties in May. Yes, that’s up 38,200 in the past 12 months, but that expansion is 62% below the median annual growth pace of 101,300 since 2010.
By industry, however, the picture is mixed. Many local bosses seem reluctant to hire as they juggle high financing costs, skittish consumers and unorthodox economic policies from the Trump administration.
Within these 15 slices of Southern California’s job market, nine cut staff during the past year, five added jobs, and one was unchanged. Contemplate those changes in local business sectors, ranked by 12-month change.
Let’s start with the job cutters …
Manufacturing: 543,200 workers – down 19,900 from May 2024. Since 2010, long-suffering factories have been losing workers at a rate of approximately 5,000 per year.
Construction: 358,900 workers – down 14,400 in a year vs. 8,300 historical growth. Costly mortgages slow projects.
Fast-food restaurants: 344,200 workers – down 9,800 in a year vs. 8,200 historical growth. Skittish consumers, combined with a lofty minimum wage, is a bad recipe.
Financial: 346,800 workers – down 8,600 in a year vs. 500 historical decline. High financing costs take a toll.
Full-service eateries/food service: 333,300 workers – down 4,900 in a year vs. 4,600 historical growth. Like we said, consumers are spending less.
Professional-business services: 1.12 million workers – down 4,500 in a year vs. 15,900 historical growth. Bosses are keeping office staff lean.
Information: 222,700 workers – down 3,600 in a year vs. 200 historical decline. Blame woes in tech and Hollywood.
Retailing: 716,100 workers – down 1,300 in a year vs. 2,700 historical growth. It’s clear that shoppers are balking.
Personal services: 266,300 workers – down 600 in a year vs. 3,100 historical growth. Again, it’s about tight wallets.
Next, take a look at where there are hiring opportunities.
Healthcare: 865,000 workers – up 40,600 in a year vs. 19,400 historical growth. The older population needs more medical help.
Social assistance: 538,500 workers – up 31,500 in a year vs. 17,400 historical growth. Also aided by aging demographics.
Government: 1,060,100 workers – up 22,200 in a year vs. 3,000 historical growth. Budget pressures suggest that this expansion will come to an end.
Private education: 220,600 workers – up 5,900 in a year vs. 4,300 historical growth. Non-public schooling is popular.
Hotels/entertainment/recreation: 280,000 workers – up 5,700 in a year, on par with history. But tourism is expected to be slow this summer.
And ponder what’s flat. The logistics-utility sector, the folks who get you the stuff you crave. Shopping is slowing – not just in-store, but also for delivery.
This once-hot niche’s 790,300 workers remain unchanged over the past year, a sharp contrast to the 14,400-a-year growth since 2010.
Jonathan Lansner is the business columnist for the Southern California News Group. He can be reached at jlansner@scng.com