 California’s weirdest and most supremely staffed city — the extremely industrial Vernon — had one city worker for every 0.8 residents.
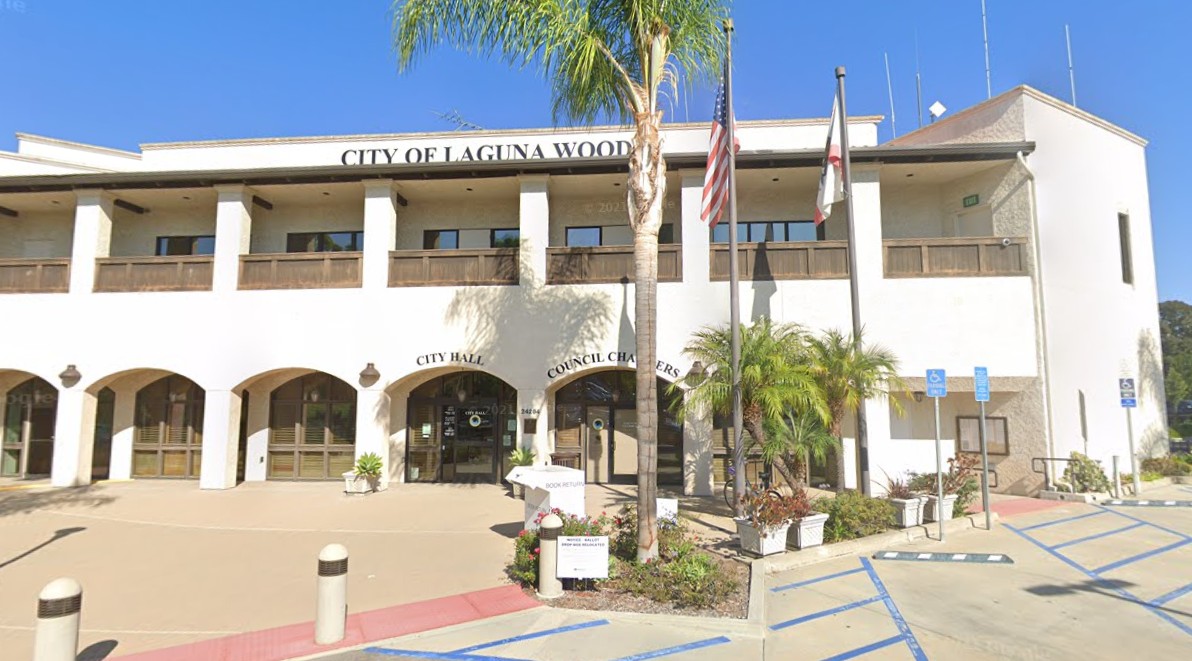
At the far other end of the spectrum, California’s most soberly-staffed city — Orange County’s own Laguna Woods — had one worker for every 1,322 residents.
Our latest fun with city data, sure to endear us even further to official types who are still sore about our pension-payments-as-percent-of-general-fund analysis, paints an interesting picture of the service levels you might expect at your local city hall. But it’s complicated, of course.
A city like Vernon is, literally, built for business. It has just a couple of hundred residents, who earn about $71,000 a year and have a median age of 28, according to our pals at the U.S. Census Bureau. Vernon has its own (expensive) police and fire departments, and city staffers primarily serve the needs of its business community.
Laguna Woods, in contrast, is a quieter community of more than 17,000, where the median age is 75 and the median income is about $60,000. It’s what’s known, in government-speak, as a “contract city,” meaning it buys police, fire and other services from other governments and companies, so it doesn’t carry those employees (or their salaries and pensions) on its own books. Contract cities are generally thriftier, but their service levels can still be quite stellar, even if they appear at the bottom of lists like this one.
So there are lots of layers here, but we still find the analysis most interesting. We’ve lived in one of California’s largest cities — with one worker for every 105 or so residents — and getting help could be a battle. We’ve also lived in one of California’s smallest cities — one worker for every 41 or so residents — and, really, it’s way different. A smaller city with more workers per resident to help is, we dare say, a far more pleasant experience.

With the possible exception of Huntington Beach’s culture wars and Los Angeles’ escapades, cities are among the most boring forms of government. Public safety is their biggest job, but they also maintain streets and parks, staff libraries, ensure the garbage is removed, run the recreation programs, decide what can be built where, issue building permits. They’re arguably the most important government in your life on a day-to-day basis, which is why we’re bothering to write about them.
For our analysis, we used 2024 payroll data supplied by cities to the state controller. It lists all positions for each city — even jobs that aren’t filled, and temp jobs, such as summer lifeguards, rec center yoga teachers and the like. To weed out part-time gigs we only included positions with total compensation in excess of $9,000.
Then, we divided each city’s population by the number of workers it has. That tells us how many residents each city has per worker. Voila!

(Photo by Mark Rabinowitch, Contributing Photographer)
What do we see? At the top of the list, not far from Vernon, we see many fancy-pants cities with lots of staffers to serve (demanding?!) residents. San Francisco clocked in at No. 6; Beverly Hills, No. 8; Carmel-by-the-Sea, No. 11; Avalon, 13; Del Mar, 14; Santa Monica, 15; Laguna Beach, 16; Big Bear Lake, 17.
Pasadena was No. 40; Los Angeles, 49; Berkeley, 50; Palm Springs, 51; Long Beach, 56; Newport Beach, 58; Torrance, 78; San Diego, 104.
The statewide average was one worker for every 113.3 residents. Anaheim, clocking in at No. 115 on the list, was just slightly more well-staffed than the average (112.1 residents for each worker), while the vast majority of O.C. cities — embracing the Orange Curtain’s reputation for thrift — fell below the state average.
We’ll be running each city’s total expenditures per capita as soon as the controller updates those numbers (the latest are for 2022-23, which sort of stinks). Meantime, these are the sort of factoids you can trot out the next time you chat with your city council folk at the next holiday tree lighting or council meeting. They’re great ice breakers! Tell them The Watchdogs sent you.